


TMVSS Veterinary
Popis produktu TMVSS Veterinary v4.0-1.2.2023
Výkonným nástrojem testovaného procesu je plně automatizovaný a neinvazní sběr dat, který nijak neomezuje hodnocená zvířata a probíhá automaticky bez potřebné obsluhy. Využívané termografické měření probíhá po automatickém načtení kusu RF-ID identifikátorem při průchodu krav kolem kamery, aniž by toto online měření narušovalo pohyb zvířete nebo mu způsobovalo bolest, či jakýkoli stres. Smyslem tohoto technického nástroje je nahradit práci chovatele a využití každodenního, mnohdy dokonce vícečetného automatického sledování jednotlivých kusů. Pro přesnou identifikaci dojnic se tedy využívá identifikace, kterou farmy disponují pro identifikaci krav v dojírně či v krmných boxech.
Využívaný systém ve svém hodnotícím algoritmu počítá se skutečností, že jednotlivá zvířata, podobně jako všechny živé organismy vykazují individuální, časovou a fyziologickou variabilitu. Z tohoto důvodu byl do algoritmu hodnocení jednotlivých sledovaných veličin zanesen prvek skupinové, individuální, ale i časové odlišnosti. Z tohoto důvodu se nelze spokojit s doposud využívaným stavem, kdy jsou jednotlivé kusy hodnoceny z důvodu složitosti a celkové variability k průměru populace, která se většinou považuje jako systém v ustáleném stavu. Pro úspěšné nastavení hodnotících procesů musí být splněny tři podmínky.
První podmínkou, která musí být splněna je, že jednotlivé hodnocené faktory zvířat musí být měřeny nepřetržitě, resp. co nejčastěji. To je zajištěno například každodenním průchodem kolem termografické kamery při každém vchodu do dojírny.
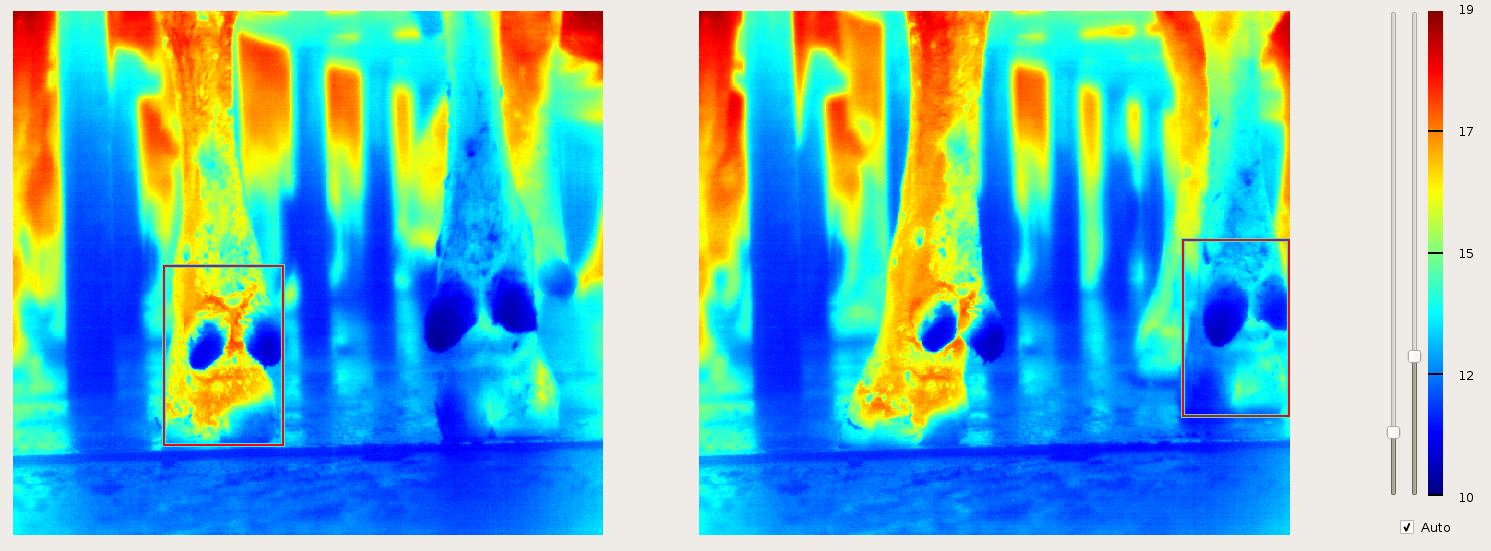
Druhá podmínka se věnuje prováděné analýze dat. Na výsledek, který upozorňuje na změnu zdravotního stavu nelze čekat a musí být chovateli k dispozici během několika minut. Výsledek o změně zdravotního stavu je obsahem tiskové sestavy, či informací pro separační branky a neodkladného ošetření jednotlivých zvířat. Zde se může jednat o onemocnění jako jsou dermatitida, nekrobacilóza či zánět paznehtu kterým před začátkem bolestivosti předchází příznaky zánětu, jako jsou lokálně zvýšená teplota, červenání, otok a porucha funkce. Včasná diagnostika tohoto změněného zdravotního stavu umožní efektivní zásah v preklinické fázi a zvládnutí celé situace bez dopadů na užitkovost, s malými náklady na léčbu a celkovému odvrácení nemoci.
Takto fungující systém se tedy svojí podstatou řadí k preventivním opatřením v každodenním zápasem s onemocněním končetin, které na mnohých farmách převyšují desítku a někde tvoří i desítky procent.
Třetí podmínkou pro efektivní uplatnění celého termografického systému hodnocení zdravotního stavu končetin je multidisciplinární biologicko-technický přístup s plně automatizovaným sběrem nadefinovaných dat a jejich online hodnocení. Všechna naměřená data jsou ukládána a mimo detekci onemocnění končetin, která jsou doprovázena lokálně zvýšenou teplotou, dávají nástroj pro hodnocení efektivity léčby jednotlivých chorob na základě průběhu naměřených teplotních veličin na postižených končetinách. V této souvislosti je potřeba zmínit, že teplota končetin se jeví poměrně individuálně pro každého jednotlivce. Nelze tedy použít jednoduché kritérium, například teplota menší než 28 st. celsia je v pořádku, zatímco vše nad 28 st. značí problém (konkrétní hodnoty teploty byly dány jako příklad)
Automatizace veškerých procesů je způsobem, jak celý proces nejen výrazně zefektivnit, ale zejména jej učinit výrazně citlivějším na první příznaky rozvíjejících se odchylek. Pokud bychom se podívali na stávající praxi (pokud je vůbec termodiagnostika zavedena), tak je prováděno měření pověřeným pracovníkem pouze několikrát do měsíce, což znemožňuje včasný záchyt prvních příznaků onemocnění, je časově náročné a vypovídající schopnost je značně ovlivněna kompetencí pověřeného pracovníka. Stejně tak občasné měření nemůže zohlednit výkyvy způsobené například znečištěním končetiny.
Automatizace naopak přináší několik klíčových aspektů pro úspěšný monitoring rozvíjejících se příznaků onemocnění:
- Jednotnost posuzování včetně nastavení mezních hodnot stavů
- Četnost měření až několikrát denně
- Časovou nenáročnost z hlediska obsluhy
- Možnost ovládání selekčních prvků
- Archivace dat a dlouhodobé hodnocení trendů
- Finančně výrazně výhodnější v porovnání s „ručními měřeními“ či měřeními vyžadujícími umístění zvířete do fixační klece
- Spolehlivost oproti jednoduchým sestavám založených na absolutních limitech teploty, případně vyžadujících manuální vyhodnocení dat
Pokud bychom se podívali na jednotlivé aspekty detailněji, můžeme je charakterizovat následovně:
Jednotnost posuzování – pokud je termodiagnostika prováděna pověřeným pracovníkem, vždy jsme závislí na jeho znalostní úrovni a schopnosti rutinně ovládat jak kameru, tak vyhodnocovat pořízené termogramy (záznamy z měření). Oproti tomu automatizovaný systém používá konzistentní algoritmus s možností nastavení víceúrovňových mezních hodnot. Je tedy možno snadno generovat sestavy s přehledem aktuálního lokomočního skóre, tak porovnání naměřených hodnot mezi jednotlivými stády i chovy. Jednotlivým kusům po průchodu je vždy automaticky určena hodnota indexu „LS“. Tento index je vypočten na základě specifických teplotních charakteristik končetin a zhruba odpovídá indexům „lokomočního skóre“ jedná se však o jiný druh posuzování, i když naměřený index „LS“ zhruba odpovídá hodnotově „lokomočnímu skóre“. Velkou výhodou oproti stávající praxi je, že pokud se hodnotí lokomoční skóre obvyklým způsobem, záchyty začínají až okolo hodnoty 3, tj. kdy má jedinec viditelné problémy s pohybem a postavením těla. Oproti tomu pomocí termografických měření indikujeme index „LS“ napříč celou hodnotovou škálou (1-5) a jsme schopni detekovat onemocnění končetin v rané fázi, kdy ještě nezpůsobuje pohybové obtíže. Příklady detekce budou uvedeny v závěrečné části materiálu.

Četnost měření – automatizovaný systém měří každý kus procházející vytýčeným koridorem, například vstupem do dojírny. V reálném provozu to znamená (pokud jsou osazeny kamerami například oba vstupy na dojírnu), že každý kus je změřen několikrát za den. To umožňuje jak záchyt prvotních odchylek zdravotního stavu, tak verifikace záchytu, případně sledování dynamiky onemocnění nebo efektivitu nastavené a aplikované léčby. Stejně tak díky automatizovanému zpracování dat je možno snadno vytvářet trendy nebo pokročilé analýzy příčin onemocnění.
Časová nenáročnost – automatizovaný systém jednoduše pracuje a jediné co z hlediska obsluhy potřebuje, je očištění kamerového systému vodou v případě jeho znečištění, například exkrementy. To platí samozřejmě v případě, že je kamera osazena ve vodotěsném krytu. Výstupem je tabulka s výpisem jednotlivých zvířat, která jsou podezřelá s jejich kategorizací dle lokomočního skóre. Pokud chce pověřený operátor, většinou zootechnik, data hlouběji analyzovat, samozřejmě tak může pohodlně učinit, neboť jednotlivé záznamy jsou automaticky přiřazeny ke konkrétním zvířatům.
Možnost ovládání selekčních prvků – vzhledem k tomu, že hodnocení je automatizované a probíhá v reálném čase, monitorovací systém umožňuje automatické oddělení podezřelých zvířat selekční brankou a umožnit tak zootechnikovi či veterináři ověření nálezu monitoringu.
Archivace dat a dlouhodobé hodnocení trendů – dnešní doba klade důraz nejen na sledování aktuálního stavu, ale též i preventivní opatření zabraňující rozvoji onemocnění. Toto generuje jednoznačný požadavek na zpětnou, dlouhodobou a detailní analýzu prováděných měření, případně vyhledávání souvislostí s externími vlivy. V praxi je toto velmi obtížné, pokud je prováděno pouze pochůzkové měření pověřeným pracovníkem. Není reálně proveditelné, aby zootechnik v pravidelných intervalech analyzoval stovky termogramů, přiřazoval je ke konkrétním zvířatům a zanášel manuálně do systému pro pozdější analýzu.
Finanční efektivita – pokud porovnáme primární investiční náklady mezi automatizovaným, a především funkčním systémem, a přenosnou termokamerou střední kategorie, automatizovaný systém bude vycházet jako zdánlivě náročnější řešení. Jedná se však o zdánlivý finanční rozdíl, který ve skutečnosti je ve zcela opačném směru. Do nákladové složky je potřeba započítat i náklady variabilní, jako je zaškolení obsluhy, čas pracovníka nutný k provedení měření, ale hlavně vyhodnocení. Pokud se daný proces pomocí „ruční termokamery“ má vykonávat skutečně odpovědně, jedná se v reálu o práci desítek hodin týdně, což výrazně ovlivní ekonomickou bilanci mzdových nákladů na pověřeného pracovníka. Současně je otázkou, zda-li je pověřený pracovník (zootechnik) schopen věnovat několik desítek hodin měsíčně této činnosti, neboť bývá obvykle značně časově vytížený. Současně je nutno vzít v potaz snížení efektivity záchytu jedinců vzhledem k výrazně nižší četnosti prováděných měření (v porovnání s plně automatizovaným systémem), stejně tak pokles vypovídající schopnosti měření v případě měření a vyhodnocování vícero pracovníky. Obecně se dá předpokládat, že při zahrnutí veškerých nákladů se ekonomická bilance vyrovná v horizontu 9-15 měsíců od uskutečnění investice, přičemž vypovídající schopnost plně automatizovaného systému je výrazně vyšší.
Spolehlivost oproti jednoduchým sestavám – V praxi se můžeme setkat s návrhy zdánlivě automatizovaných řešení, a to buď založených na mezní přípustné teplotě (např tmax>250C) spouštějících záznam, nebo na řešeních, které s každým průchodem dojnice spouští záznam snímků a ukládá je. V prvním případě (mezní přípustná teplota) nedovoluje metoda nastavení dostatečné citlivosti vzhledem k přirozenému rozdílu teplot končetin mezi jednotlivými zdravými kusy a oscilaci těchto hodnot v závislosti na denní době a ročním období. Tento rozdíl může být až 100C u zdravých jedinců, takže tento postup vede buď ke značnému množství falešných alarmů, nebo jeho necitlivosti. Přístup druhý (prosté zaznamenání termogramů s každým průchodem) v praxi znamená, že zootechnik bude trávit hodiny vyhodnocováním termogramů, což vnáší do problematiky nejen aspekt časové / finanční náročnosti, ale i nejednotnost v posuzování jednotlivých nálezů. Takováto pseudo-automatická řešení vedou jen ke zklamání uživatelů a, krom své finanční náročnosti z hlediska vysokých variabilních nákladů, vykazují vysokou míru nejistoty a tím i reálnou neaplikovatelnost.
Pokud tedy učiníme porovnání mezi efektivitou pokročilého automatizovaného řešení a „přenosného“ řešení, ať již z finančního, tak výkonnostního hlediska, tak obě kritéria hovoří jednoznačně ve prospěch automatizovaného řešení – v případě vypovídací schopnosti ve prospěch automatizovaného řešení okamžitě, z ekonomického hlediska v řádu několika měsíců s narůstající ekonomickou výhodností nad tímto časovým horizontem vzhledem k prakticky nulovým variabilním nákladům na provoz. Pokud by bylo zapotřebí, autoři jsou připraveni zpracovat individuální kalkulaci ekonomických parametrů pro jednotlivé chovy.
Aplikační příklady:
Dermatitida
Na následující grafu je uveden vývoj indexu „LS“ v jednotlivých dnech: jednotlivé body značí vypočítanou hodnotu a její porovnání s hraničními hodnotami pro stupně 1, 2, a 3.


Na grafu je jednoznačně viditelný trend vývoje indexu, kdy 31.10. je možno vidět první překročení úrovně LS1. trend je jednoznačně narůstající až do okamžiku ošetření 2.11., kdy byla indikace nasazeného automatizovaného systému potvrzena v rámci ošetření paznehtu s nálezem na obrázku. Po ošetření je možno vidět, že detekovaný „index LS“ doznal výrazného zlepšení (hluboko pod hranicí LS1). nicméně dochází k jeho opětovnému růstu, tedy zřejmě vhodnosti opětovného ošetření. V této souvislosti je třeba podoktnout, že postižený kus neměl viditelné známky problémů s pohybem. Stejně tak stojí za povšimnutí časová dynamika rozvoje indexu – tj. řádově ve dnech.
Nekrobacilóza
Na následující grafu je uveden vývoj indexu „LS“ v jednotlivých dnech: jednotlivé body značí vypočítanou hodnotu a její porovnání s hraničními hodnotami pro stupně 1, 2, a 3:

Na grafu je možno pozorovat první známky okolo 29.10. které jsou potvrzeny trendem v následujících dnech (možno použít jako příklad, proč je zapotřebí měření provádět kontinuálně a sledovat vývoj hodnot, nikoliv pouze izolované hodnoty) až do ošetření 2.11. s následujícím nálezem:

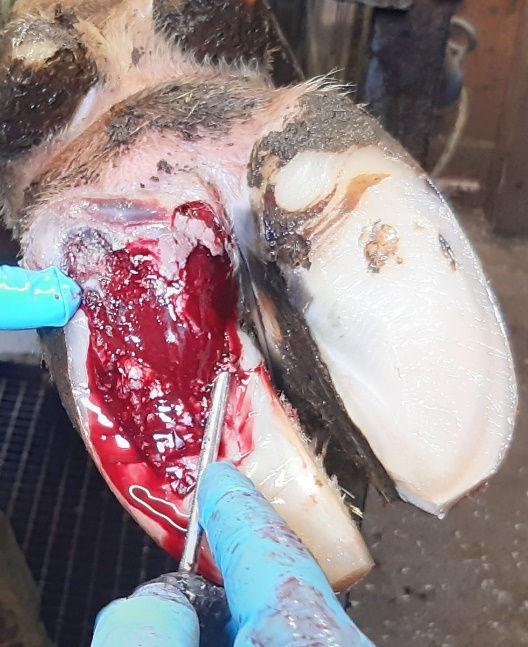
Z fotodokumentace je možno vidět, že ač postižení nekrobacilózou nebylo v běžné provozu viditelně, jednalo o zcela prokazatelné postižení, jak je vidět na obrázku znázorňujícím pazneht po ošetření. Z výše uvedeného grafu je též velmi dobré zlepšení indexu „LS“.
Uvedené příklady jednoznačně dokumentují možnost záchytu nemocných jedinců v počátcích rozvoje onemocnění, což v důsledku plyne v efektivnější možnosti léčby i lepší přístup k jednotlivým kusům.
Je třeba zdůraznit, že se jedná o pokročilý automatizovaný systém, tedy o ucelený celek, jehož výstupem jsou sestavy s generovaným hodnocením lokomočního skóre a vývojem specifických teplotních ukazatelů. Za automatizovaný systém nelze považovat řešení, kde je nutné manuální vyhodnocení termogramů operátorem, zootechnikem, případně zdánlivě efektivní řešení překročení mezní teploty na končetině.